


By Bob Friel
Of all the recent changes in the Salish Sea ecosystem, one of the most visible is the virtual disappearance of the Western grebe. Our inland sea was once the preferred winter habitat for 70% of the entire population of this stately black-and-white waterbird with its swanlike neck and devilish red eyes. Today, though, after summering on lakes and wetlands where they perform one of the earth’s most spectacular mating rituals and raise their chicks on floating nests, only about 4% of Western grebes return to spend the cooler months in Salish Sea waters.
Over the last 20 years, the population size of grebes has fallen across their range, with some of the culprits for this being oil spills in California’s marine waters where a large population of grebes spends the winter, as well as pollution and other human impacts on the grebes’ freshwater breeding grounds. However, these factors don’t fully explain the dramatic 90% drop in the Salish Sea winter population.
A prior groundbreaking SeaDoc seabird study showed that the Salish Sea’s specialized hunters—sushi lovers like loons, scoters, and grebes—were all being hit hard by declines in high-quality forage fish like herring. That’s another major piece of information, but still doesn’t complete the puzzle. For that we’ll need to ask the grebes themselves by tracking them so precisely that they tell us what’s going on with the changes in their populations and migratory patterns.
Scientists today have all kinds of cool tech tools to help track wildlife. But while suction-cupping a GPS transmitter to a blue whale has no effect on the 200-ton beast, it’s much more taxing to strap any external device on a four-pound waterbird that not only has to retain the aerodynamics to fly, but also the hydrodynamics and waterproofing needed to dive, swim, and catch fish.
Enter the bionic bird.
The idea of implanting a small telemetry device inside a bird’s body cavity is not new. It had even been tried before with grebes. Unfortunately, that experiment had disastrous consequences for every one of the test subjects. Paging SeaDoc to the operating room, stat!
Across two recent studies, SeaDoc veterinarians, in collaboration with other wildlife veterinarians from the UC Davis Oiled Wildlife Care Network and USGS, as well as biologists from Washington and California's Departments of Fish and Wildlife, first made sure the improved surgery worked in captivity. (Read the study). They then used the revolutionized surgical methods on grebes captured in the San Francisco Bay.
As a proof of concept it was a great success, with an 89% survival rate for the first 25 days after release. (Read the most recent study). Two grebes continued broadcasting data for more than 14 months until their transmitter batteries died. We tracked one of those birds across 2,144 kilometers as it summered in Oregon before returning to the Bay Area—the first roundtrip migration of a Western grebe ever recorded in real time!
While we have no plans to create flocks of bionic birds, our studies achieved a big leap forward in wildlife surgical techniques and, with continued improvement, should assist in providing enough future tracking data to inform decisions about habitat protection and pollution mitigation that we hope will help recover our Western grebe populations.
Banner photo: Western grebe with implanted satellite transmitter. Courtesy of Joe Gaydos.


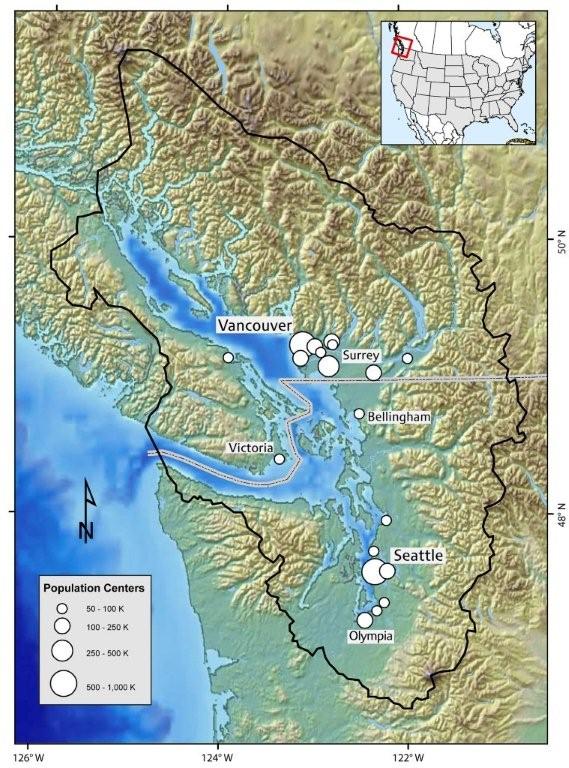 The Salish Sea is a 17,000 sq. km. ecosystem consisting of the Puget Sound Basin (in the US) and the Georgia Basin (in Canada). Efforts to heal the Salish Sea depend upon good cross-border collaboration. Map: N. Maher